Abstract : Evolution of plasma parameters have been recorded by the Data Acquisition system. The outgassing effects have appeared. Present plasma instabilities are caused mainly by the pulsing RF power from the microwave oven. The injected RF power is recoded satisfactorily.
Some details are given in [1] for other pulses.
Pulse #248 and #251
The pulse belongs to a series produced at relatively high density in relation to the ECRH cut-off frequency at 2.45GHz. The neutral pressure at 298K is around 5 x 10¹⁸ m-3 for this series of pulses.
* The pressure rose importantly at the beginning of the plasma formation. It is a normal phenomenon in all fusion devices and it tends to create important problems in many of them.
In UST_1 the reasons for the rise of pressure may include:
- particles from the wall of the VV perhaps H2O and H during the plasma pulse,
- particles coming from the antenna and the HN connector (not totally high vacuum compatible),
- the absence of a limiter,
- the existence of a coaxial line inside the vacuum and arcing or plasma inside the coaxial line.
The mass spectrometer gave as much H2 and H2O as N2 and O2 in absence of plasma and these gases are the components of the plasma during the first tenths of second. The mass spectrometer will operate together with the plasma pulses in a future.
It is the first pulse of this series and the rise of pressure seems more important in this pulse (not well proved because the #251 could be slightly weaker). It is reduced in subsequent pulses, like in pulse #251, see Fig 2.
* The pressure rose up to 1.6 x 10¹⁹ m-3 at the end of the pulse #251. It must be reduced at least an order of magnitude and try to work at neutral pressure of ~1 x 10¹⁹ m-3 . However it is impossible in UST_1 due to the cut-off density and because overdense ECRH heating tend to achieve only 5 - 10 times the cut-off density (TJ-K, WEGA). So it is a serious problem in UST_1 because working at so low pressures as 1 x 10¹⁸ m-3 in UST_1 is difficult and moreover wall conditioning is very poor. In any case it will be improved to the best.
* In almost all the pulses an important positive phenomenon is produced. It indicates that the RF power signals are working correctly at some degree.
▪ The signals RF Reversed max. and RF Forward max, in cyan and magenta see Fig 1 and 2, are similar, so the absorbed power in the VV is small when :
- there is no plasma
- there is arcing or plasma inside the internal coaxial line.
▪ And the injected power (the difference between the Forward and the Reversed) increases two fold when there is a complete plasma in the VV.
* The hard disk, a very old model, takes excessive time to save the data and it produce data artefacts. They are notable in #251. It will be solved in brief.
* Most of the plasma instabilities are likely caused by the pulsing 50Hz RF power from the microwave oven. Fig 3 shows the Forward RF power obtained from the Schottky Diodes Detectors. The sampling rate is 500samples/second so each cycle of 50Hz is defined by 10 points. The RF power is approximately a shifted senoidal signal from 0 to Max. at 50Hz due to the half wave rectifier common in most of the commercial microwave ovens. It can be improved in a similar manner as in KAIST-TOKAMAK, a Korean tokamak, [2] and other more advanced methods to obtain a smother RF power.
* Still some interferences are observed in the signals, probably due to the oscillating RF power. They are not excessive and will be reduced if the RF power supplies are enhanced. So it will not be improved.
* Sometimes the plasma extinguish without a reason during the TF ON period. If happens for example in pulse #248 and some other pulses but not in #251 and others. A cause could be the continuous switch on and switch off of the plasma caused by the RF power.
* The oscillation in the images is caused, very probably by the periodic RF power. The sequence of frames in pulse #246 and others, recorded at 30 frames/sec, are observed as : low plasma intensity, high, high, low, high, high, low...The sampling rate of 30Hz (33.33ms) together with the 50Hz (20ms cycle) results in the frequency of the recorded pulsing plasmas although the frequency is 50Hz.
* The plasma heating is mostly electron cyclotron resonance heating because the plasma stops when the magnetic field finishes. It happens in almost all the plasmas.
* NOTE : The injected RF power is proportional to the Forward - Reversed voltages measured by the detectors. The proportionality constants were supplied by the seller. The diode detectors are not very accurate but have fast response and are robust. Thermal detectors have the oposite features.
* A spectrum of the line emission from the plasma was obtained as a test to know in what degree it was feasible. An incomplete faint spectrum was recorded. Better spectra could be recorded. However it was concluded that these spectra are useless to calculate T and n for these type of plasmas (low T, many impurities, low n). So the idea is abandoned. The spectrum is shown in Fig 4.
Further developments
Build the Langmuir probe system. Study the possible improvement of the RF power supplies. Improve the antenna. Install a kind of limiter. Discover if the stub tuner is doing a function and under what conditions.
References
[1] "Pulses from #227 . Improving the plasmas, ECRH, diagnostics and data acquisition systems" , Vicente M. Queral. See All past research
[2] "Simple microwave preionization source for ohmic plasmas" W. Choe et al. REVIEW OF SCIENTIFIC INSTRUMENTS VOLUME 71, NUMBER 7.
![]() Video
of pulse #251
Video
of pulse #251

Fig 1. Pulse #248. Evolution of the plasma parameters during the pulse. The graph still lacks of the most important parameters, T and n, that will obtained soon from the Langmuir probes.
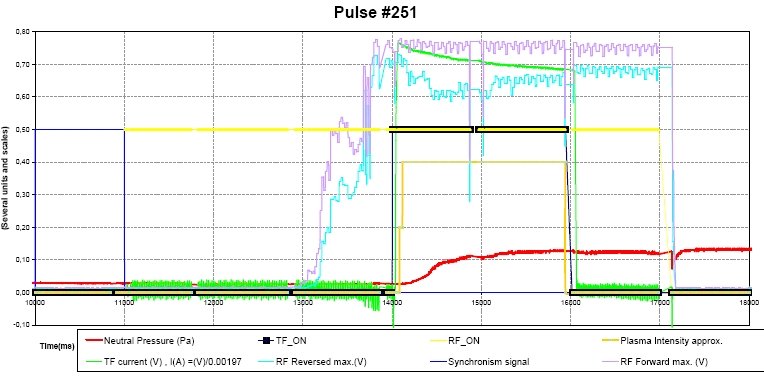
Fig 2. Pulse #251. The outgassing is inferior in spite of a longer pulse. The time used by the hard disk to save the value, approx. one each second, are unluckily located on the fall down of the signals and it distorts the image.

Fig 3. Pulse #251. Forward RF power obtained from the Schottky Diodes Detectors and the Data Acquisition System. The pulsing RF power at 50Hz is observed.
![]()
Fig 4. Pulse #254. A part of the plasma spectrum in the visible range. It is the first spectrum obtained was as test and the green and blue region are out of the focus. It will not be improved due to lack of usefulness.
Date of publication 07-06-2007